
Southern Ocean Hydrography Climatology - an update
This work involves in aggregating the historical temperature-salinity profiles collected in the Southern Ocean south of 45°S and a further spatial interpolation procedure to extrapolate the localized temperature and salinity measurement to the coarser climatological grid (0.2° x 0.1°, longitude x latitude). The interpolation scheme is a Southern Ocean Atlas legacy, where an elliptical searching area with a 2:1 ratio between the majori and minor axis length is applied on each grid point to determine the profiles used to create the local climatological mean value. In Southern Ocean Atlas, the ellipeses were aligned zonally to take accout for the largely zonnally oriented large scale ocean circulation such as Antarctic Circumpolar Currrent (ACC). In our version, we adjust the alignment of each ellipse using the local dynamic topography derived from Southern Ocean State Estimate (SOSE), such that the elliptical average can account for more gyre or sub-gyre scale to even mesoscale scale dynamics when constructing the climatological mean value (Figure 1). The size of ellipse is adjust according to the local bathymetry to account for different dynamic regimes on and off the continental shelf (Figure 1).
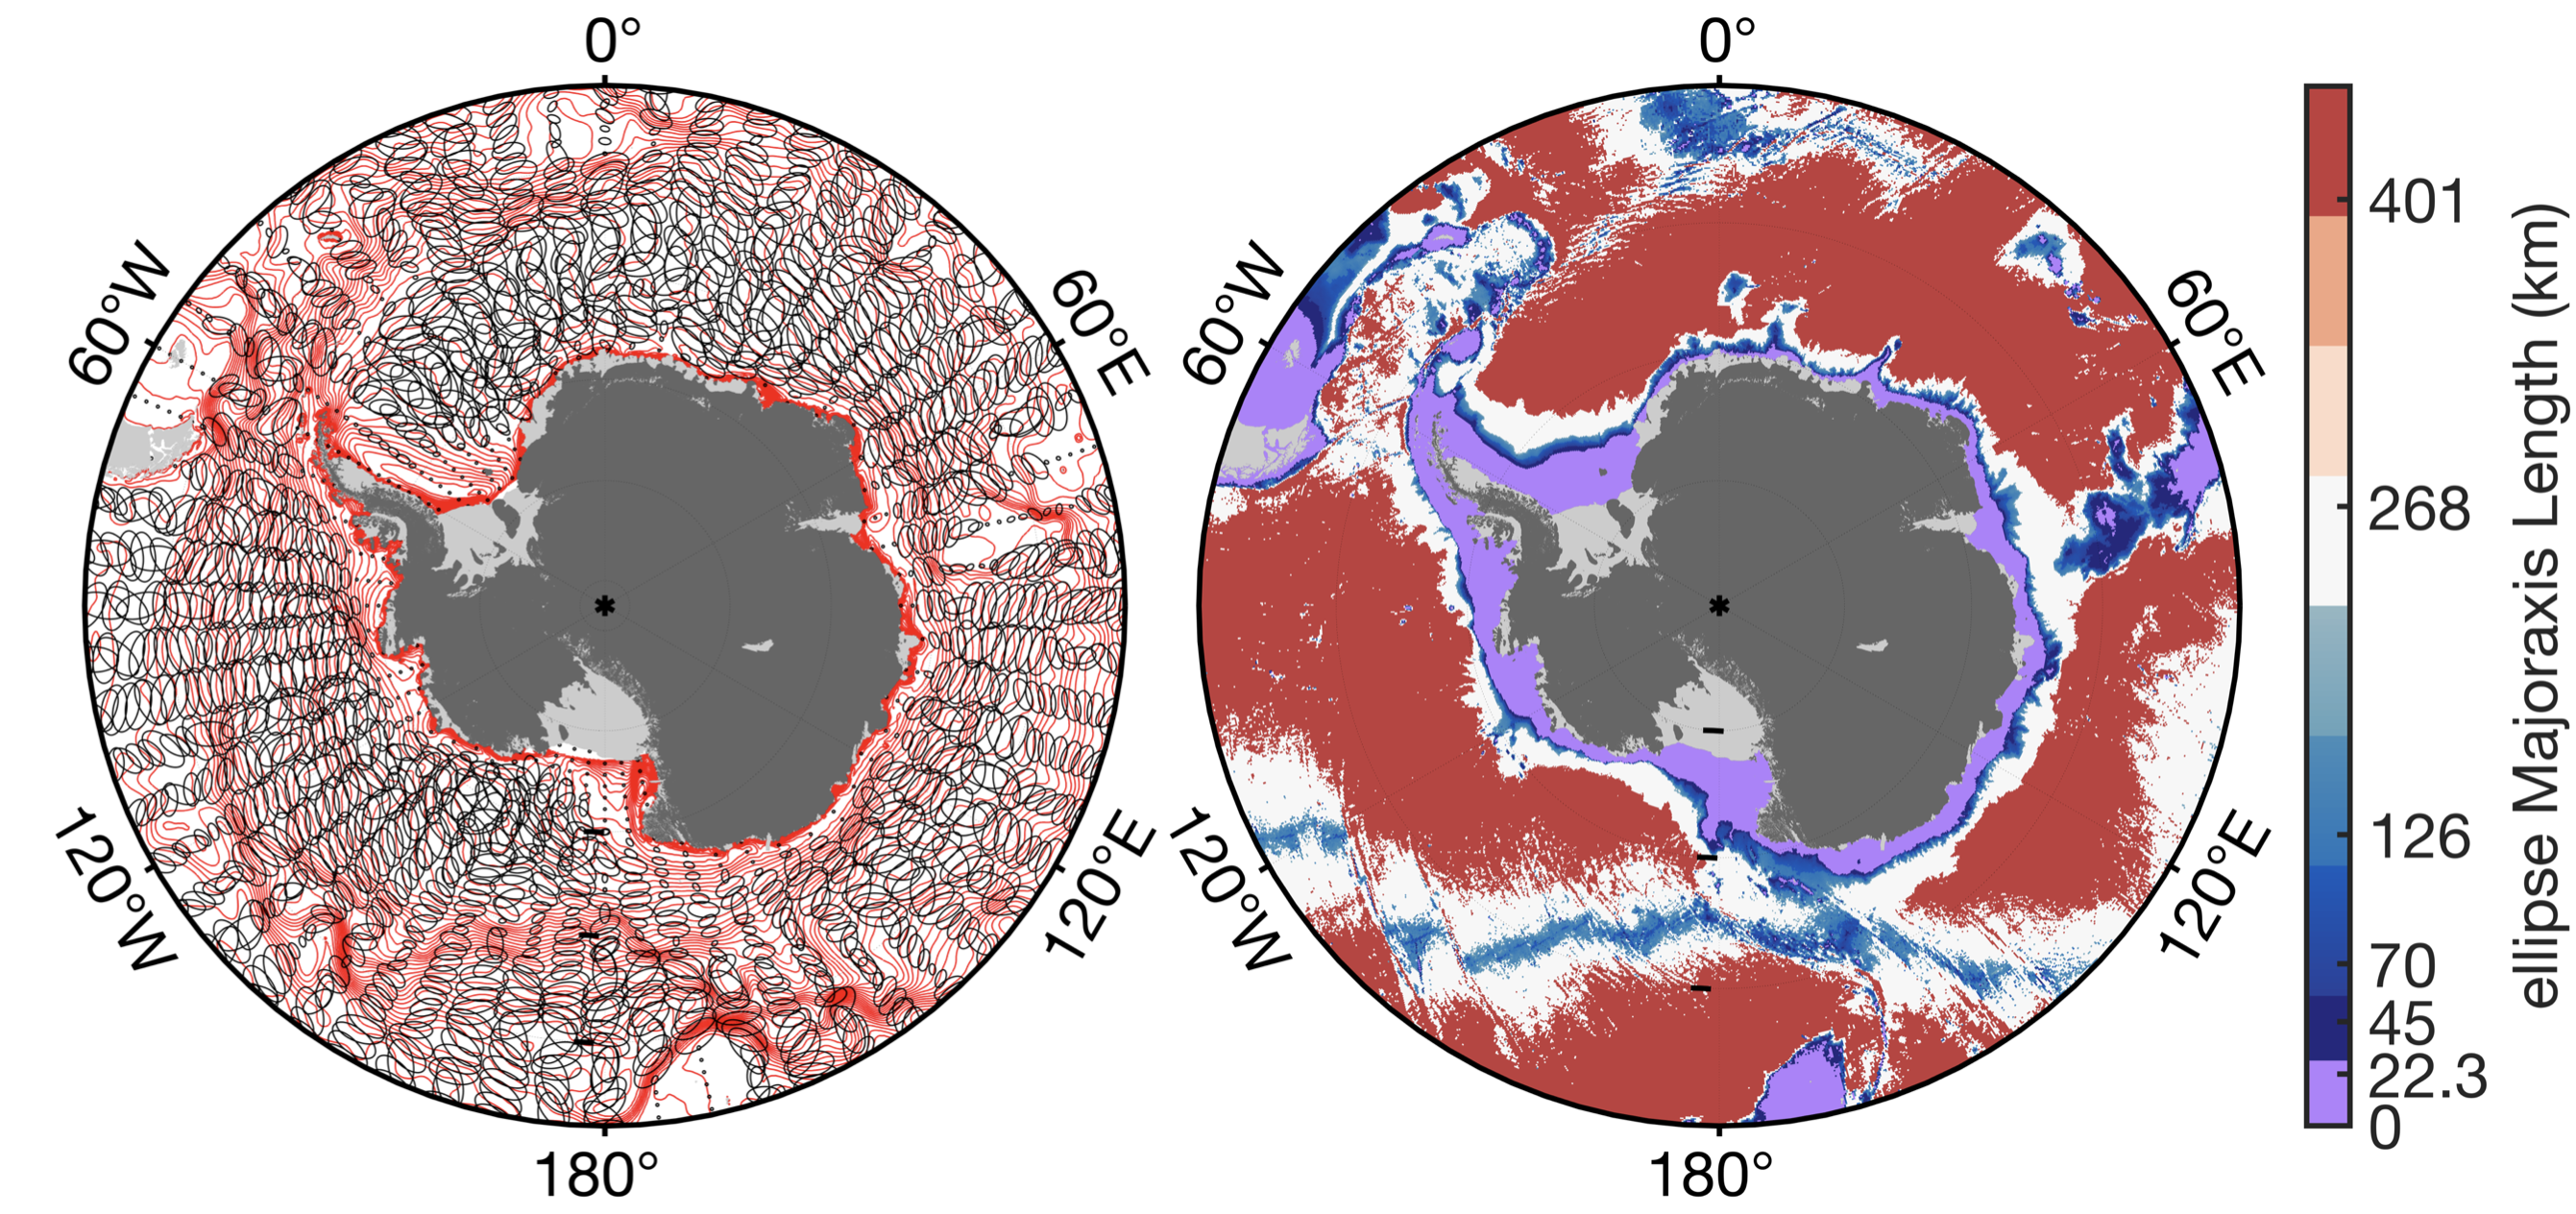 Figure 1. (left) The ellipses used in our climatology aligning with SSH contour (red) from SOSE. (right) The majoraxis length (km) of each ellipse varying with local bathymetry.
We then construct 2D maps for metrics that are of our interests such as the temperature of Circumpolar Deep Water (CDW) which is the primary source of heat that leads to Antarctic ice shelves melting. The comparison between our climatology and the SOSE results shows high consistency (Figure 2), suggesting that the climatology is capturing the broad the picture of the thermohaline characteristics of the Southern Ocean water masses. Version 1 of the profile compilation is now published at SEANOE data repository and freely downloadable. Please get in touch if you are interested in using the climatology product.
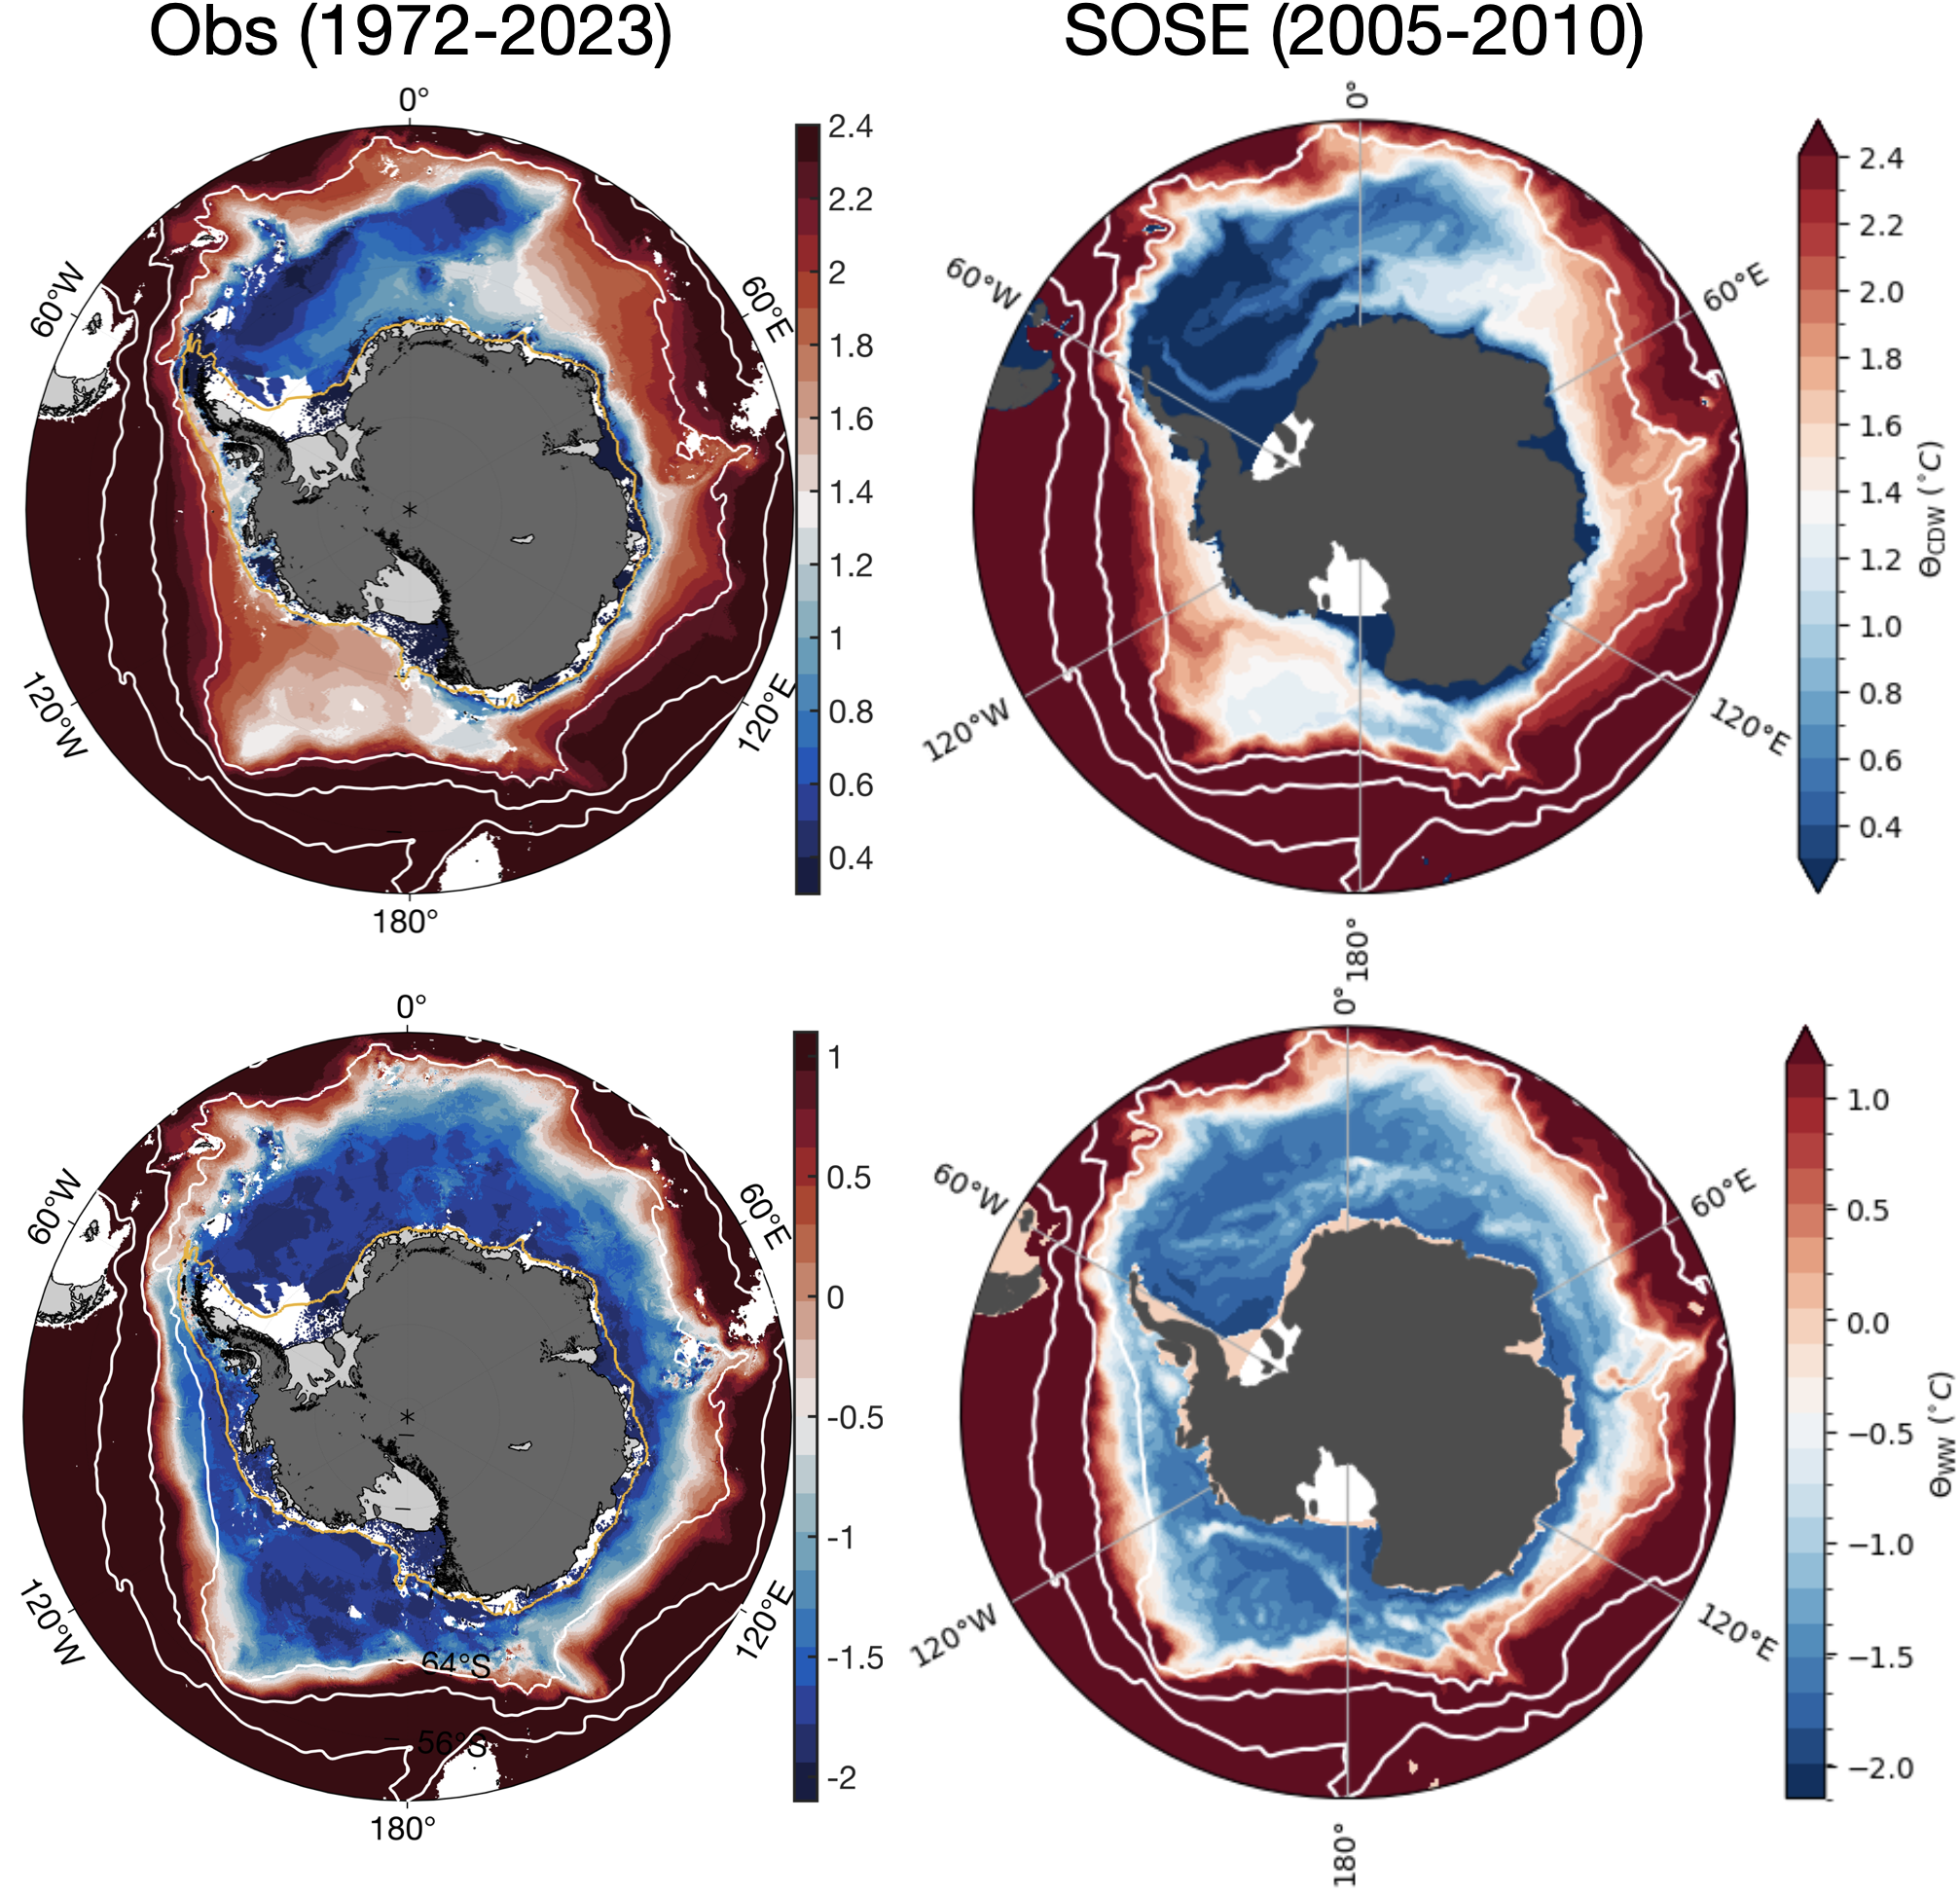 Figure 2. (left column) The conservative temperature map of CDW (upper panel, defined as the temperature maximum below 200 m down along the water column) and winter water (lower panel,defined as temperature minimum between 50 to 400 m down along the water column) from our climatology. (right column) Same field derived from SOSE output.